workouts
How can I filter the diary entries for activities with common attributes?
14/02/13 10:49 Filed in: Diary
Problem: The diary windows left pane has preconfigured filter modes for date, equipment and workout types. But you would like to see all entries of an arbitrary common property, month or year.
Solution: in the diary window search field, you can for entries that match common attributes. The following examples may give you a picture of what that is capable of.
Examples:
- Search for fragments in the comment field. For example 'evening run' would find all entries that contain this text fragment in their comment field.
- This enables you to use tagging. For example you could make yourself up a tag like 'x-withDog' 'x-fromWorkToHome', enter these tags into any activities comment and then search for those.
- You can also search for parts of the date. Enter '2011-' to find all entries of that year or '2011-03' to find all entries of that month. or -'03-' to find all entries of in March of every year. (for your interest, the full date format is yyy-mm-dd)
How can I compare multiple workouts
29/07/11 17:21 Filed in: Help
Problem: You have several similar workouts and would like to compare these to each other.
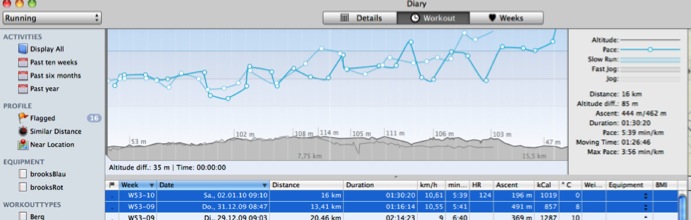
Solution: open the diary window and drill down to similar workouts by either using the similar distance filter on the left or by flagging selected workouts and the filtering for these.
Now select multiple entries in the table and compare the charts in the Workouts view. The newest of the workouts is being drawn in the most saturated color.
How can I see the average pace/heartrate/speed for only a part of my workout?
22/04/12 10:50 Filed in: Help
Problem: When you import a workout as an activity in the diary, TrailRunner displays average and maximum values for speed, heart-rate for the whole workout, but how can you see these values for fixed split intervals or even a selected range like an uphill part only?
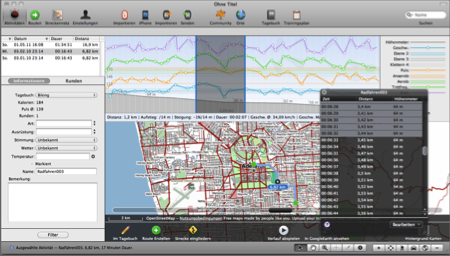 Solution: Within the graph, select a range to view the average/maximum values within that range. To get a more precise selection, e.g. to select km 1 to 2 or minute 60 to 90, open the black info panel that is available next to the lower window tools and directly select value ranges using a single-click to select the first value and shift-click to select the end of the selection range.
The elevation data download looks to be very inaccurate
22/04/12 10:53 Filed in: Conceptual
Problem: When TrailRunner downloads elevation data from the internet service, the elevation data looks inaccurate and does not match the GPS or odometer recordings of my GPS device
Description: TrailRunner downloads elevation data from a source that originally retrieved the data from NASA satellite measurements. What NASA did was to scan the surface of the earth and to record the topmost spot found during the recording. This could be the street level surface, a mountain peak or -- and that's probably what you are facing -- the top of a house or tree.
Solution: The error described comes from false GPS recordings. If your recorded GPS point is slightly off track due to a measurement error of your GPS, then the wrong elevation data point is being downloaded. Unfortunately there is no solution to this problem. Just ignore the spots where this had happened or correct the values by hand.
Hint: To correct values by hand, open the black info panel and manually enter elevation data value for spots that seem to be inaccurate.
What is "My Best Performance"
22/04/12 10:53 Filed in: Conceptual
Problem: The diary displays My Best Performance. But that was not my fastest performance. What is it then?
Explanation: My Best Performance is based on the fitness value you achieved. The theory behind that is your most economic run — not necessarily your fastest.
On Fitness: In TrailRunner, the fitness is a calculated value based on the average pace and heart rate of a workout. The idea is that if you where very fast with a low heart rate you are fitter, while the opposite applies if you where very slow and had a high heart rate. This value is just for orientation and does not have the accuracy of the methods used in Polar watches or other biometric methods, but it gives a pretty good overall impression. To compare your fitness values to average adults, take a look into this table.
Modify workout courses
04/01/13 22:43 Filed in: Import
Problem: You forgot to turn off your GPS device or the signal was very weak at the beginning of your workout. You would like to trim your recorded workout data at the beginning and/or end.
Background: You can only modify workout courses for activities while you are about to import them. Once they are within the diary, it's not possible anymore to alter them.
Solution: Use the track-point inspector panel to modify the activities track before you import the activity.
There are two techniques you can now use to correct the data to be imported before you actually import them. In both cases, first open the track-point inspector panel in the bottom toolbar:
1) Select the range you want to remove. In the track-point inspector panel select the 'trim selection' command. This will remove all data points from the selection up to the nearest edge.
2) Select one data point, e.g. the first datapoint of the presumable next workout. In the track-point inspector panel, select the 'split at selection' command. This will remove the selected data point and create two new entries for either side of the selection.
Reference: Please also see Tutorial > Import Activities
TrailRunner and Suunto compatibility
14/10/10 09:36 Filed in: Import
Problem: You have a Suunto fitness device and you want to display the recorded data in TrailRunner
Background: The Suunto applications Trek Manager and Track Exporter are only compatible with Windows.
Solution: Suunto offers a Webservice called Movescount that is compatible with Mac OS X.
> Use TrailRunner with Suunto Devices
Background: The Suunto applications Trek Manager and Track Exporter are only compatible with Windows.
Solution: Suunto offers a Webservice called Movescount that is compatible with Mac OS X.
> Use TrailRunner with Suunto Devices
Append workouts into one
04/07/10 13:25 Filed in: Import
Problem: You made several activity recordings and want to append each single activity to one concatenated representation.
Background: You can only append activities to each other while you are about to import them. Once they are within the diary, it's not possible anymore to alter them.
Solution: In the import pane, place a checkmark on each entry you want to concatenate. In the lower toolbar, use the Append toolbar button to replace both by a concatenated representation. Each activity will be represented as a lap within the resulting placeholder activity.
Missing Activities
14/02/13 10:49 Filed in: Conceptual
Problem: In the main window, the activities list does not display entries that previously have been there. But I can find these in the diary.
Solution: Below the activities list there is a Filter Button. Please check if you have set a filter that hides the entries you where looking for.
Solution: Below the activities list there is a Filter Button. Please check if you have set a filter that hides the entries you where looking for.
Activity workout splits and caclulated aggregates
19/03/10 12:21 Filed in: Conceptual
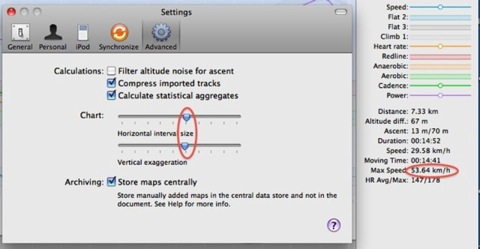
Problem: When you drag the slider in the horizontal interval settings, the value for maximum speed changes. Why is that so?
Explanation: TrailRunner can display the maximum speed value from either the imported workout data (if available) or can calculate the value by an analysis of your workout data.
On statistical aggregates
If your GPS Device has lost its signal and re-catches it, the recoded course may contain errors. This error may lead to unrealistic values as such signal jumps may assume you where moving faster that light. Therefore TrailRunner uses a low-pass filter of roughly 90% and takes the highest value within the result as your maximum speed. To turn this off, uncheck the calculate statistical aggregates option.
On split intervals
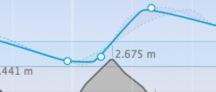
The horizontal interval size slider controls the size of interval splits.
The intervals are being displayed as white lines in the graph, each containing a white circle on the value that was most common within this interval.
In addition the lowest values and the highest values within this interval are being displayed as a dot bordered gray region.
The overall maximum speed of an activity is the maximum speed from all these split intervals.
As this is a statistical calculation, the values may vary when you change the size of the split intervals. The bigger the intervals, any filtering becomes stronger.
Explanation: TrailRunner can display the maximum speed value from either the imported workout data (if available) or can calculate the value by an analysis of your workout data.
On statistical aggregates
If your GPS Device has lost its signal and re-catches it, the recoded course may contain errors. This error may lead to unrealistic values as such signal jumps may assume you where moving faster that light. Therefore TrailRunner uses a low-pass filter of roughly 90% and takes the highest value within the result as your maximum speed. To turn this off, uncheck the calculate statistical aggregates option.
On split intervals
The horizontal interval size slider controls the size of interval splits.
The intervals are being displayed as white lines in the graph, each containing a white circle on the value that was most common within this interval.
In addition the lowest values and the highest values within this interval are being displayed as a dot bordered gray region.
The overall maximum speed of an activity is the maximum speed from all these split intervals.
As this is a statistical calculation, the values may vary when you change the size of the split intervals. The bigger the intervals, any filtering becomes stronger.
Difference between ascent, descent and elevation
18/08/14 13:15 Filed in: Conceptual
Problem: In the altitude histogram, TrailRunner displays three values derived from altitude values. These are named elevation, ascent and descent. What's the different between these?
Description: Elevation is the absolute difference between the highest summit and the lowest valley. It may also be named altitude difference or altitude range.
Ascent is being displayed as ascent/descent value which is the gain in only positive / negative altitude differences.
Example: With an altitude series of 10, 13, 15, 13, 11, 16
the elevation is 10..16 = 6
the ascent is 10..15 + 11..16 = 10
and the descent is 15..11 = 4
Tip: As most GPS receivers tend to be very inaccurate with the recoding of altitude data, the ascent and decent values can become unnaturally high as only small gains can sum up to huge values. In TrailRunner > Preferences > Advanced you can set a high pass filter for the ascent/descent calculation. See Filter altitude noise.
Additional note: It may even happen that you record a round-trip and the ascent and descent values differ. This comes from the simple fact that altitude recordings made by a GPS are extremely inaccurate. To calculate the altitude, the GPS requires good reception of at least three satellites. If reception differs during two visits of a location, the derived ascent and descent values will also differ.
Can I merge GPS data with workout data?
10/02/10 21:12 Filed in: Import
Problem: Is there an easy way to merge GPS data and HR data into TrailRunner?
Solution: When your heart-rate data contains distance information, the you can do the following:
- First import the track from your GPS device, iphone or file and make a route of it so that it appears in the routes list.
- Remove the activity as otherwise you cannot add a new activity for the same date. - Then import your workout from your ForeRunner 50 or HRM file and select the route in the import panel.
TrailRunner will now merge the Heat-rate data and the GPS Data based on the distance information.
Note: For not GPS enabled workout devices you require a food-pod while your where running as TrailRunner requires distance information for the matching.
Diary: Display speed over distance instead of pace over distance
18/01/10 11:24 Filed in: Diary
Problem: Is it possible to display the average speed in km/h or mph instead of pace?
Solution: An activity is always assigned to a diary. And a diary can be of a sport type like running, biking, etc.
If you change your default diary to the sport type biking, it would affect the display for all entries within this diary.
TrailRunner > Preferences > Personal > Diaries: Select the diary and then change the type in the table Popup.
TrailRunner is cutting of graph edges
07/04/10 14:17 Filed in: Conceptual
Problem: As depicted in the screenshot above, TrailRunner sometimes cuts off high values within a chart.
Background: To analyze a workout, the most interesting part of the chart is the area your workout did spend the most time in. If your GPS signal was weak and produced a noise peak, this single error would decrease the vertical resolution of your graph and therefore would make it unreadable. For this reason TrailRunner cuts off the chart for everything that is located outside of approximately 90% of your data points.
Customizing: To customize this behavior, you can control the display range under TrailRunner > Preferences > Advanced > Chart : Vertical exaggeration.
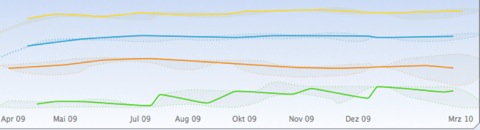
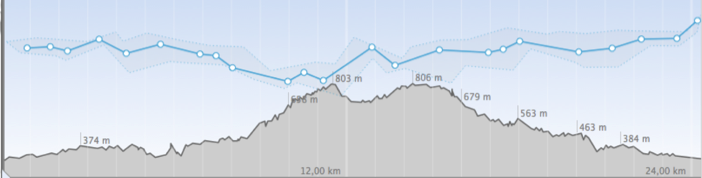
Problem: As depicted in the second screenshot above, the head or tail of a chart may not be displayed.
Background: The chart above displays a statistical trend. This means that TrailRunner takes all data points available, creates a set of intervals (in this case one month per each interval) and then displays a representative data point for this interval. The representative is the value that had the highest statistical appearance within the interval (mathematically this is called a median, not average). Then a data point is being displayed at the location of the representative. As this is almost never at the beginning or the end of the interval the graph seems to be cut off.
Sidenote: Please also note the gray border around the graph lines. The border depicts the maximum and the minimum values within each interval. So the graph gives you a good overall picture on the trend including extreme values. All data points are located within the gray area and the most frequent values are depicted by the colored line.
Does TrailRunner support the Polar XXX monitor?
29/01/10 18:48 Filed in: Import
Problem: TrailRunner is not able to directly import Polar Workout data from the monitor.
Solutions: Using third party helper applications, TrailRunner may read data files created by these application. Known solutions are:
- With TrackRecord you can download workouts for some SonicLink Polar devices but Infrared is not supported.
- If you can manage to download HRM files with e.g. a windows emulator and Polar software you can import the file into TrailRunner. But it requires that you have worn a foot-pod during the workout as TrailRunner relies on the distance information to display a workout chart and merge the workout data with the course of a route.
- Any other application that can export GPX and TCX files from Polar devices can be used too, as TrailRunner can import these file formats.
> Supported Devices
Unsupported watches are: Polar RS300X
PS: Please let me know if you found a working solution.
How can I export my diary
14/02/13 00:29 Filed in: Diary
Problem: While TrailRunner already has some statistical graphs built in, you sometimes still want to create your own graphs like e.g "calories burnt per kilometer".
Solution: Select the diary entries in TrailRunner and use Edit > Copy to paste the data into an external spreadsheet application like Numbers or Excel. To select all entries in TrailRunner, use Command-A.
Tip: If you import your data into Excel, make sure that the column separator is set to "tab separated".
What's the resolution of the workout data graph?
27/04/09 22:39 Filed in: Import
Problem: When I view my workout data in other applications like garmin training center, the data points for heart-rate and speed are much more noisy detailed than in TrailRunner. Additionally the TrailRunner graph seems not to start at the left edge of the chart but appears to be indented. Furthermore a TrailRunner graph line sometimes is being drawn as a straight line without any intermediate data points, although there should be some.
Background: Other applications display the raw data of a device. This makes the graph unreadable. The philosophy of TrailRunner instead is to display the overall trend and development of your workout session.
Approach: TrailRunner has an auto split feature where the workout is being sliced into fixed distance intervals. For each interval the statistical median value is being calculated and one data point reflecting this value is then being used as a representative. As the location of the representative can be somewhere in-between the first interval, the graph might appear to be indented. Furthermore if representatives in adjacent intervals fall onto a straight line, only the edges representatives are being drawn and the connection line depicts the trend development.
Details: The auto split feature uses the following distance intervals. By the time of this writing it’s 250 m for workouts shorter than 10 km, then 500m up to 20 km, 1000 m up to 50 km and 10000 m from there on. A route with 42 km would then have 5 intervals.
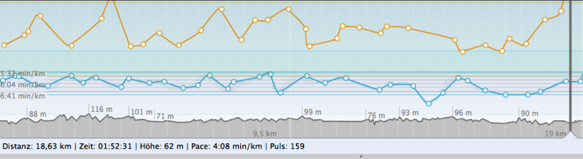
Example: Below the identical workout in Garmin Training Center (upper image) and TrailRunner (lower image)
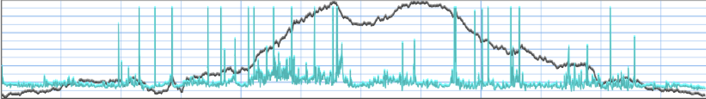
It’s rather obvious that the speed Graph in Garmin Training Center is full of noise and false signals. TrailRunner filters this out and gives you the statistical trend (blue line) for each interval (white circle within each interval separated by a white vertical line)
The thinner line around the blue line depicts the value range, so you still can make up that within the interval there was a great spread of values, but most of the time you stayed near the value depicted by the thick line.
BTW please note that the Garmin speed graph is upside down, so slower is a value near the top and faster is a value near the end. TrailRunner uses a the natural, mirrored display approach, where “better” is on top.
Background: Other applications display the raw data of a device. This makes the graph unreadable. The philosophy of TrailRunner instead is to display the overall trend and development of your workout session.
Approach: TrailRunner has an auto split feature where the workout is being sliced into fixed distance intervals. For each interval the statistical median value is being calculated and one data point reflecting this value is then being used as a representative. As the location of the representative can be somewhere in-between the first interval, the graph might appear to be indented. Furthermore if representatives in adjacent intervals fall onto a straight line, only the edges representatives are being drawn and the connection line depicts the trend development.
Details: The auto split feature uses the following distance intervals. By the time of this writing it’s 250 m for workouts shorter than 10 km, then 500m up to 20 km, 1000 m up to 50 km and 10000 m from there on. A route with 42 km would then have 5 intervals.
Example: Below the identical workout in Garmin Training Center (upper image) and TrailRunner (lower image)
It’s rather obvious that the speed Graph in Garmin Training Center is full of noise and false signals. TrailRunner filters this out and gives you the statistical trend (blue line) for each interval (white circle within each interval separated by a white vertical line)
The thinner line around the blue line depicts the value range, so you still can make up that within the interval there was a great spread of values, but most of the time you stayed near the value depicted by the thick line.
BTW please note that the Garmin speed graph is upside down, so slower is a value near the top and faster is a value near the end. TrailRunner uses a the natural, mirrored display approach, where “better” is on top.
Garmin Training Center shows a different distance as TrailRunner does
15/04/13 18:52 Filed in: Import
Problem: Your ForeRunner device displays a distance for a workout. Garmin Training Center displays the same distance but TrailRunner displays a different distance.
Background: During the workout, your ForeRunner records geographical data points. At the same time your ForeRunner internally adds up the distances as a total distance so far. If you have intelligent recording enabled on your ForeRunner and the GPS signal quality isn't too good, the device will alter the recorded geographical course -- and therefore the derived distance -- after it knows better. Problem is that at the same time the overall distance should also be adjusted, which is not the case.
Status: To avoid confusion, TrailRunner usually displays the distance your device is displaying. But it could happen that the real distance, based on the mere data points, "slips through" in TrailRunner. This indeed is contradictory information but at the same time it is like impossible to me to "do it right".
What's the difference between activities, workouts, routes, tracks and way-points?
22/12/10 09:37 Filed in: Conceptual
Problem: You have used other applications that import tracks and these never use vocabulary like activity, route or workout. Why is TrailRunner not using the same terms? And by the way, what is the difference between a track, an activity, a route and a workout?
Background: TrailRunner is more or less two applications in one: on the one hand a route planning application managing a personal network of tracks and on the other hand a journal for your sport activities. For your better understanding, please take a look at the TrailRunner QuickGuide. The differences should be obvious after you have read it. If not, please be so kind to let me know what you do not understand so I can improve either the QuickGuide or even TrailRunner.
> QuickGuide Tutorial